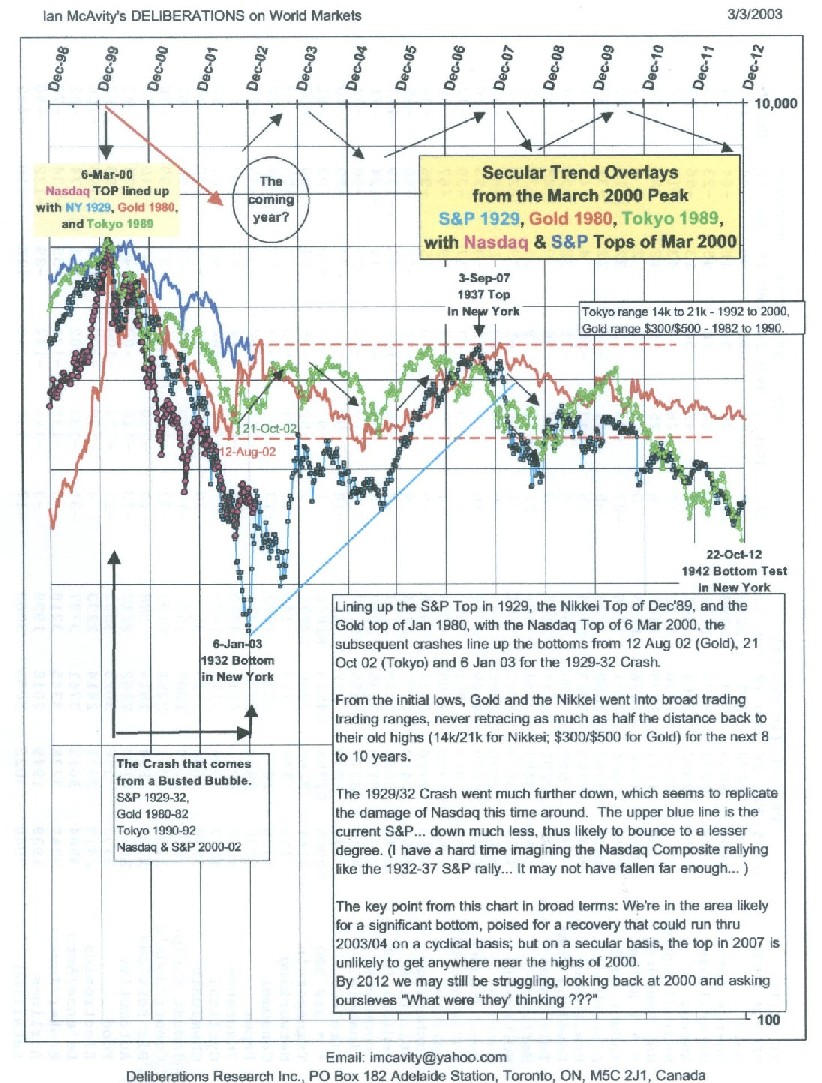
For a vivid illustration that spectacular rallies do, indeed, take place both within secular bear markets and secular non-bull markets, take a look at the rather amazing chart on the back page of the report. The chart was created by old friend Ian McAvity, a brilliant analyst who produces some marvelous long-term charts in his Deliberations newsletter and the e-mailed supplements to it (where this chart came from). His "Busted Bubbles" chart lines up the 2000 NASDAQ top with the New York top in 1929, the Gold top in 1980 and the Tokyo top in 1989. In all three past cases, a very significant rally began about three years after the tops - corresponding to a bottom, this time around, between August of 2002 and January of 2003. And the rallies that followed really were "very significant": 50% in the Nikkei, 66% in Gold, and over 100% in 1933. In addition, as we have noted in past reports, the 1992-93 Nikkei rally of 50% fits in very nicely with the advances seen in the cyclical bull markets of 1970-73, 1974-77 and 1978-80, all of which took place during a secular non-bull market. The chart on the back page and the fact that the four-year cycle was due to bottom in 2002 thus make a rather compellingly powerful case for a cyclical bull market during the next year or two.
(After that? Well, even a 50% advance would leave prices well below their 2000 highs, creating a secular "lower high"- but it would then take a "lower low", a low below last year's low, to confirm a seculat bear market. Since that lower low is hardly a given, we prefer to call what we are in now a secular non-bull market. First, though, we need to get a cyclical bull market underway - and that is proving to be no easy task.)
Ian's Deliberations service, by the way, is a steal at only $225/year; just one good idea is worth much, much more than that - and there are a lot more ideas than that in it. Send your check to the address on the bottom of the chart on the back page.
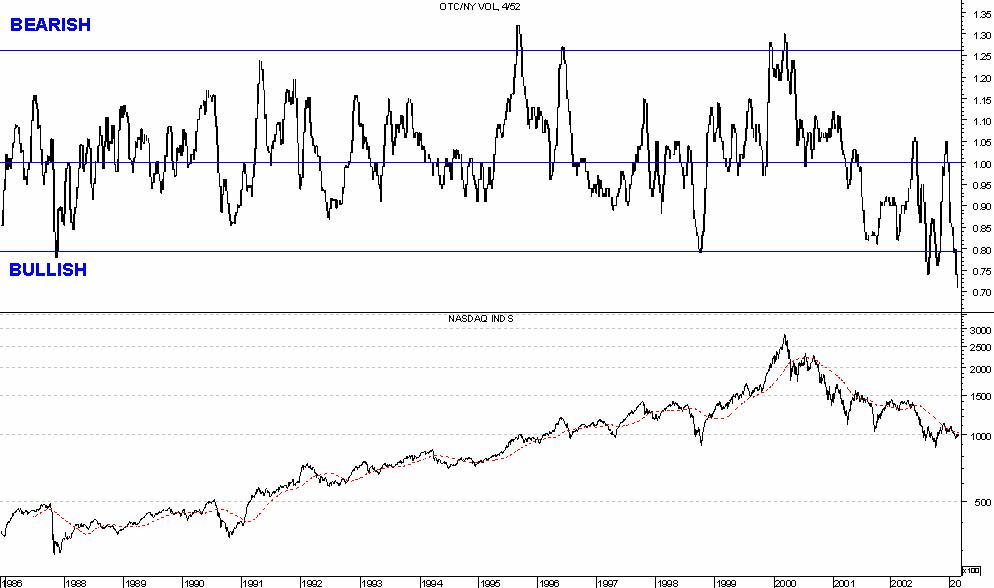
THE MARKET NOW. The market acts like it is "sold out", as evidenced by the very low volume and the persistent deeply-oversold readings in the long-term oscillators. (A "sold out" market is one where the sellers have finally run out of stock for sale, as opposed to an "oversold" market, which has gone down a lot in a relatively short time.) The low volume is especially evident on the NASDAQ, where our normalized NASDAQ/NYSE volume ratio has fallen to a new low; further evidence that big NASDAQ stocks will lead the early stages of the next recovery. The S&P currently has support levels and/or objectives of 818-819, 810-812 (its current short-term objective), 806 (the February 13th low) and 785-790 (its longer-term objective), and the 806-812 area should be enough to contain a "normal" short-term decline (which this one looks like). The important thing, though, is that the market still acts like it is staging a successful test of the July-October lows, as evidenced by things like the low volume, the extraordinarily-high assets in Rydex's bearish funds, and the market's failure to build up momentum on the downside (unlike the case in June-July and September). As long as the market continues not to build up any significant downside momentum, the testing process will continue to unfold in a normal fashion, although we should note that the market often stages a frightening-looking lurch or two to the downside at the very end of a testing process. We still think the big question here, though, is when (not if) and at what level the test will be completed. We are still waiting for some powerful upside momentum to indicate that a new advance has begun - but the evidence says that we could see the completion of the test and that powerful momentum at any time now.
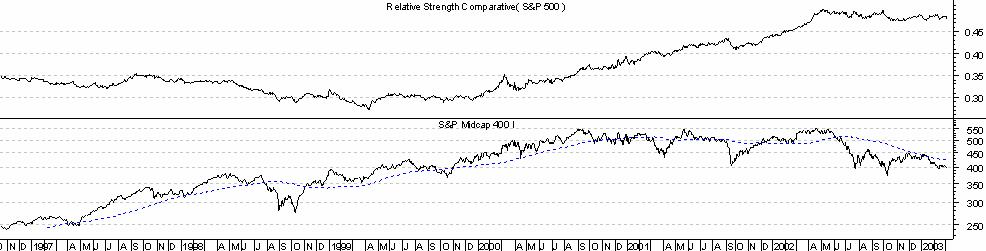
LEADERSHIP. Big-cap stocks traditionally lead the early stages of a new bull market; they are the easiest to buy and are also usually hardest-hit during the final stages of the prior decline. We expect the next advance to be no exception; in fact, the recently-beleaguered big-cap NASDAQ stocks have been generating some rather impressive relative strength of late, and thus look like they will be the initial leaders of the next rally. Mid-cap and small-cap stocks, however, are showing encouraging strength at this early stage of the bull market (they normally save their best performance for later on, when investors' confidence has had a chance to rebuild and their appetite for easily-buyable stocks has been satiated). Mid-cap and small-cap stocks also made a secular low in terms of relative strength in 1999, as the charts on the first chart page in the back of the report show, and their new secular relative strength uptrends remain very much intact at this point. Since mid- and small-cap stocks traditionally do better and better as a bull market progresses, we expect them to take on more and more of a leadership role as the bull market unfolds and end up being the cyclical bull market's main leadership theme.
STOCK COMMENTS. Some people are concerned by the now-heavy weighting of financial stocks in the S&P, 21%. We are not concerned (yet); among other things, the heavy weighting reflects a reduction in technology stocks' weightings much more than an increase in financial stocks'. More importantly, we have long favored regional bank and brokerage stocks, where the financial sector leadership has been and still is (over two dozen regional bank stocks are currently trading at or near new 52-week highs) over money center banks and investment banking brokerage stocks. We therefore think that the best course of action in the financial sector is to overweight regional bank and brokerage stocks while underweighting big ones. In the meantime, the NASDAQ would be in good shape if more stocks looked like eBay; unfortunately, they don't. Cisco, though, has been building what should turn out to be a major base below 16, and a surge through that level would complete it. Symbol Technologies also looks like it is building a major base here. Finally, ponder the action of Boeing, Lockheed and Northrop Grumman, which all hit 52-week lows this week; the chart of NOC is not exactly in keeping with the daily headlines.
OUR OWN MONEY remains fully invested in mid-cap and small cap funds via positions in Phoenix Small Mid Cap, PKSFX, a mid-cap growth fund, Vanguard Selected Value, VASVX, a mid-cap value fund, Perkins Opportunity Fund, POFDX, a small small-cap growth fund, and Acadian Emerging Markets Portfolio (AEMGX, which I consider a small-cap fund); although the S&P is still working against a downside objective of 785-790, I think the upside potential far outweighs the downside risks at this point. (In fact, my only real disappointment thus far is the Perkins fund; Perk has a huge position in Insignia Systems, and its recent implosion has cost the fund dearly. Perk assures me, though, that both the stock and the fund are still in good shape.) My Fidelity Select money, meanwhile, is also 100% invested via positions in the Multimedia (FBMPX) and Telecommunications (FSTCX) funds and the PIMCO RCM Biotechnology fund (DRBNX; I switched from Select Biotech into DRBNX last summer for tax reasons).
THE BOND MARKET has worked its way back to within a point of its September all-time highs. Given things like the recent heavy inflows into bond funds (inflows disturbingly similar to the inflows into Janus-type funds in 2000), however, we think the bond market is, at best, in a wide-swinging trading range. As such, further upside potential appears to be pretty limited at this juncture and risks appear relatively high, so we do not think bonds are attractive here - and, in any case, stocks should have much, much more upside potential than bonds do at this point. (Note: The foregoing comments apply only to Treasuries; other areas of the bond market, particularly junk bonds, should perform much better than Treasuries at this stage of the financial and economic cycles, and thus look relatively attractive here.)
BEST AND WORST GROUPS. Charts of the four best and worst-performing groups during the last seven weeks may be found, as usual, in the back of the report. To supplement those lists: Oil & Gas Drilling rose onto the top four list for the first time this week while Leisure Products fell off; meanwhile, Integrated Telecommunications fell onto the worst-performing list this week while Advertising resurrected. (The groups moving out of each category are probably the most timely to look at.)
OUR FIDELITY SECTOR FUND relative strength work weakened a bit further this week as one more fund, Industrial Materials, slipped back below the money market rate of return. This brought the percentage of funds outperforming cash down to 15%, which keeps it in oversold territory, and the percentage will have to rise above 33% to generate a new "buy signal". The holdings in our switching program, meanwhile, are unchanged from a week ago: the #1 Gold fund, #2 Energy Services and #3 Natural Gas. Finally, the two highest-ranked funds this week are Gold and Energy Services and the two lowest-ranked are Retailing and Airlines.
MAJOR OVERSEAS MARKETS. The European market's fate undoubtedly depends on our own; if our market stages a cyclical bull market, the European markets undoubtedly will too. The Japanese market, meanwhile, is continuing its valiant basing attempt (the Nikkei took over three months to undercut its prior low despite a barrage of bad news hitting the Japanese market almost daily), and we therefore think the Nikkei has the most recovery potential of all the major overseas markets here.
Walter Deemer
(c)2003 DTR Inc. All Rights Reserved